Situation in global markets
Demand for tanker transportation is affected by a number of factors, including supply and demand for crude oil and oil products, the availability of refining capacity and storage facilities, the economic situation in global and regional markets, the distances over which oil and petroleum products are transported, and competition from other modes of transport.
Supply in the tanker market is also affected by a number of factors, including the pace and quantities of new ship deliveries, old tonnage disposal rate, conversion of existing fleet, and changes in industry regulation
Oil market
Crude oil production in OPEC countries decreased from 33 million barrels per day in November 2018 to less than 31 million barrels per day in February 2019 and remained at this level during 2019, negatively affecting the demand for tanker transportation up to the fourth quarter. Key reasons for the decrease in crude oil production included Saudi Arabia’s policy of sharply reducing crude oil exports, even beyond the commitments under the OPEC+ deal, and the forced reduction of exports by Venezuela and Iran due to political and economic pressure. Brent prices rose since the beginning of 2019, averaging US$57.36 per barrel in January and reaching US$67 per barrel by the end of February, but then remained at US$62-63 per barrel during the rest of the reporting period.
Tanker market
Excess of tanker tonnage supply over demand due, in particular, to an increase in speculative tanker orders amid a short-lived market rally in 2015, in combination with the OPEC+ output cap, resulted in freight rates for crude oil carriers reaching the lowest levels in the past 25 years not long before the start of the reporting period. The fourth quarter of 2018, however, saw some signs of recovery in market conditions. Tanker markets grew, largely thanks to the decisions taken to revise the agreement limiting crude oil output and amid the seasonal increase in demand for transportation of crude oil and petroleum products, and by the beginning of 2019 the rates reached the level seen at the end of 2015.

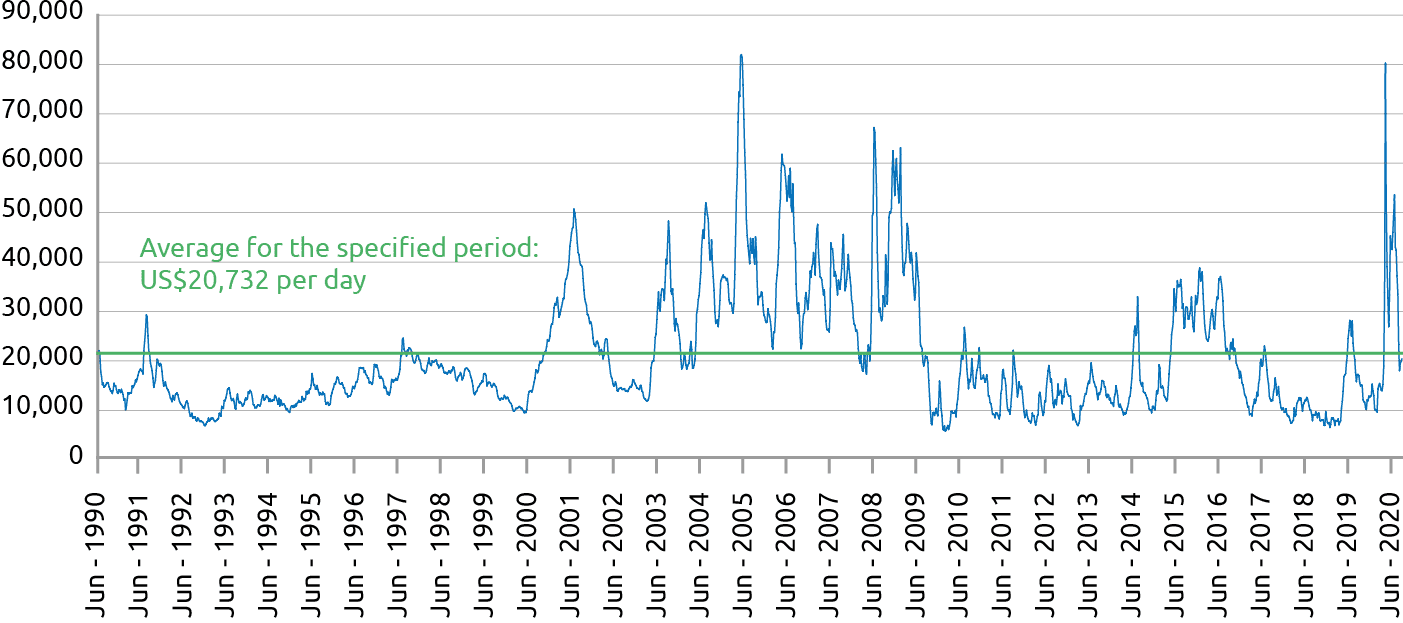
Given the positive trends in the fourth quarter, in 2019 the ClarkSea Index averaged US$22,168 per day, almost twice as much as in 2018 (US$11,216 per day). The lowest value of the index was recorded in 1992 at US$8,983 per day.
The high market period continued until the end of February 2019. In March, freight rates for crude oil tankers declined significantly and remained at low levels during 2Q and 3Q 2019. Despite an improvement in the fundamental demand and supply balance, tanker markets saw a decline by the end of Q1, which was mainly attributable to a decrease in exports from Iran and Venezuela resulting from sanctions and, to a considerable extent, a sharp cut in exports by Saudi Arabia under the OPEC+ agreement.
The drop in spot rates in March did not affect demand for time charter contracts for crude oil tankers and LR II ships owing to positive fundamental expectations and uncertainty about the impact of new requirements for marine fuel under IMO 2020. Time-charter rates were progressively rising during 2Q and 3Q 2019.
Expectations of a rise in tanker rates were realised at the end of 3Q and during 4Q 2019. The explosive growth in tanker rates was triggered by an attack on Saudi Arabia’s oil infrastructure in September 2019 and the sanctions imposed by the U.S. against one of the largest VLCC owners in October 2019. Also, during the year there was a significant increase in demand for crude oil transportation by large-capacity tankers due to a rise in U.S. oil exports.
As a result, tanker rates for some destinations reached record levels since the beginning of the century amid high short-term market volatility. In some cases, the rates for VLCC and Suezmaz carriers exceeded US$250,000 per day.
A rise in rates was recorded virtually for all destinations of shipments by oil tankers and (to a lesser extent) by product tankers. Despite an increase in the demand for transportation of refined products, growth in rates in this segment during the year was constrained by the fundamentally excessive supply of tonnage. The switch to transportation of crude oil by some large-capacity product carriers had a positive effect on the rate dynamics in petroleum products shipping markets during the second half of the year.
During the past period, tonnage supply growth rates in the tanker market declined significantly due to a decrease in the number of new vessels put into service against the background of the existing fleet’s obsolescence. Also, there was a decline in new ship ordering activity of shipowners, with the ratio between the new order portfolio and global fleet size being at a historical low.
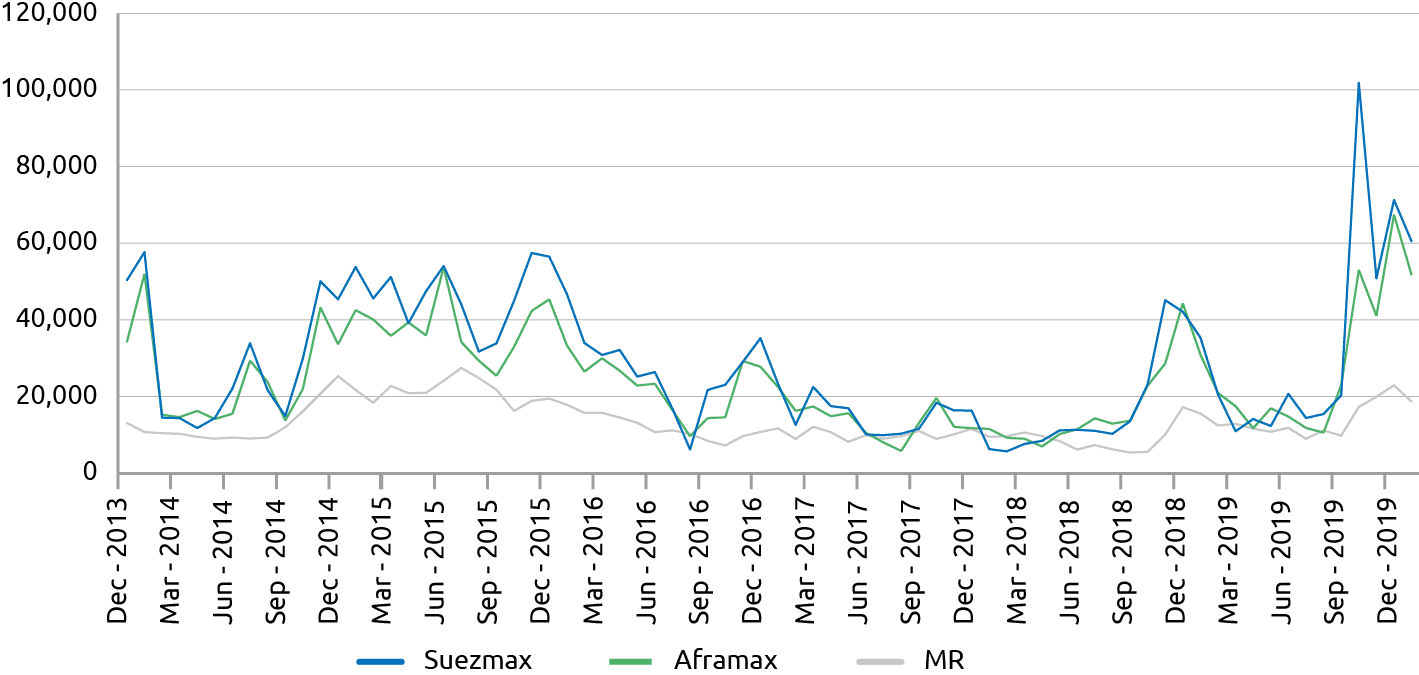
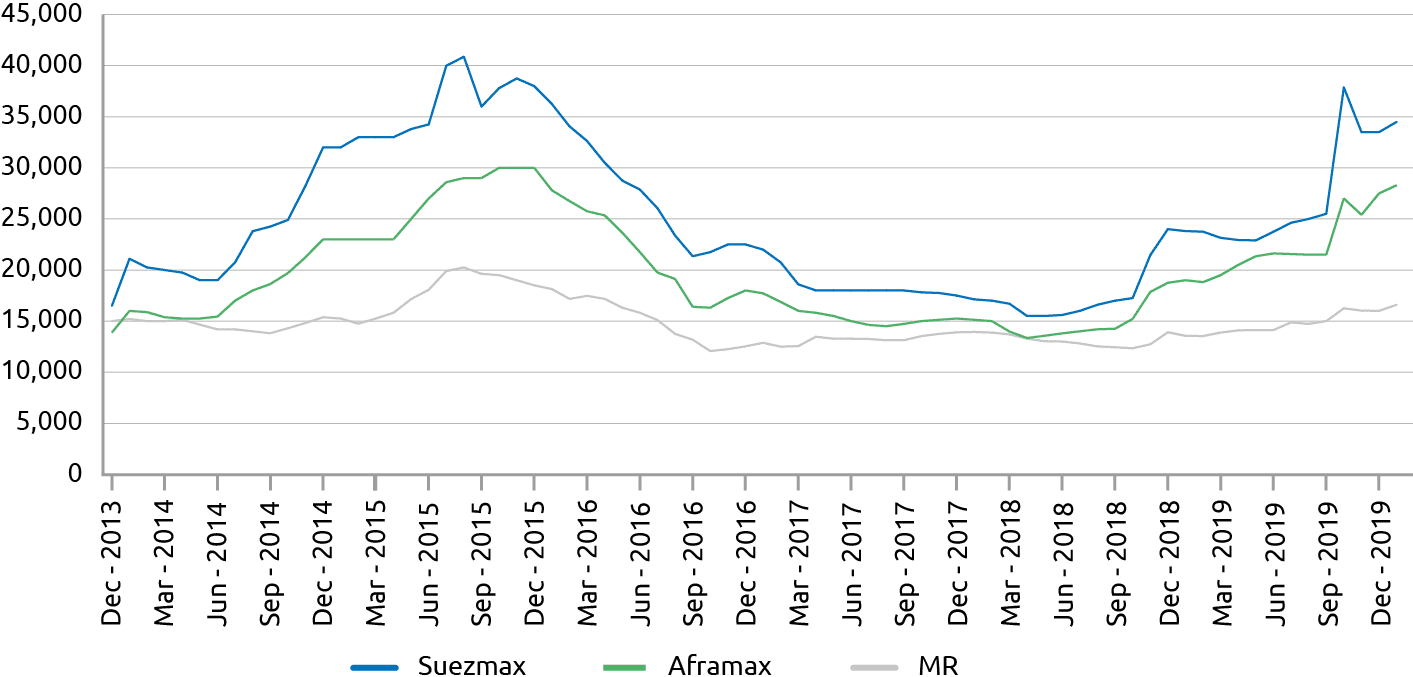
As a result of a substantial market improvement in 4Q the weighted average spot TCE in some segments exceeded that for 2018 by more than 100 %. Weighted average one-year time charter rates also increased significantly.
| Vessel size category | 2019 | 2018 | Difference, % |
|---|---|---|---|
| VLCC tankers | 41,364 | 15,561 | 165.82 |
| Suezmax tankers | 31,560 | 16,466 | 91.67 |
| Aframax tankers | 26,225 | 16,175 | 62.13 |
| MR product carriers | 13,740 | 8,750 | 57.03 |
| Handysize product tankers | 14,560 | 6,734 | 116.22 |
| Vessel size category | 2019 | 2018Clarksons Research Services data for 2018 as of 31 December 2019 were updated in comparison with similar data as of 31 December 2018. | Difference, % |
|---|---|---|---|
| VLCC tankers | 36,358 | 22,899 | 58.78 |
| Suezmax tankers | 26,649 | 17,486 | 52.40 |
| Aframax tankers | 22,091 | 14,925 | 48.01 |
| Product carriers (dark petroleum products) | 14,683 | 13,120 | 11.91 |
| Product carriers (light petroleum products) | 13,425 | 11,572 | 16.01 |
LNG shipping market
2019 saw significant fluctuations in both short-term and long–term markets for LNG transportation.
The beginning of the year was marked by a fall in the spot market from a historical high of about US$220 per day for a modern vessel achieved in 4Q 2018 to US$50 per day and less, depending on the vessel type, by the beginning of 2Q 2019. The lowest rates in April 2019 reached US$20,000 for a vessel with a steam turbine and US$35,000 for a trifuel vessel. By the beginning of the fourth quarter spot rates showed a strong seasonal growth, from US$100,000-140,000 per day for prior generation vessels to US$150,000 for modern vessels. This spike, however, was quickly replaced by a fall, failing to reach the previous year’s record levels. The main reasons for the market fall probably include a significant decline in demand for LNG due to unrealized fore-casts of temperature drops in the winder period, a reduction in arbitrage supplies due to a sharp fall in gas prices, commissioning of new vessels, and cargo programmes being covered by medium-term transportation contracts in advance.
The beginning of 2019 was also marked by increased activity of charterers in concluding long-term charters for newbuilds to cover long-term contracts for gas supply with the commissioning of new LNG facilities around the world and to replace prior generation vessels in the fleet. By mid-year charter rates for seven or more years peaked at US$71,000 for a newly built standard gas carrier. Amid increased activity from charterers orders for new gas carriers from both well-established shipowners and newcomers in the gas segment increased significantly. The number of speculative orders without pre-agreed transportation contracts rose considerably. In the second half of the year, the demand for long-term contracts from potential charterers declined substan-tially due to the current needs being sufficiently covered and investment decisions on new long-term projects being postponed to a later time. As a result, rates for modern ship sizes under long-term contracts concluded by the end of 2019 dropped to US$60-62.
The increase in market volatility in 2019 similarly to 2018, the rise in the number of players, amount of free capacity and additional volumes indicate a further reorientation of conventional gas transportation to the medium and long-term market model. All SCF Group vessels are employed or being built for long-term LNG transportation contracts for major international charterers and projects.
New build and S&P market
The demand in the second-hand vessel market in 2019 was 12.80 % higher than in 2018, with 379 deals (total deadweight: 34,127 thousand tonnes, total value: US$5,952 million) against 336 deals (total deadweight: 32,015 thousand tonnes, total value: US$4,995 million) in 2018. A significant factor in the initial decline in buyers’ interest in tonnage, apart from low freight rates, was the uncertainty regarding the impact of the approaching entry into force of the 0.5 % cap on sulphur content in bunker fuel from 2020 and the need to factor in investments in ballast water treatment systems that must necessarily be installed on vessels during dock repairs after September 2019. Due to the same factors prices for second-hand tonnage dropped significantly in 2019, and this in turn attracted buyers to the market.
During the first three quarters of 2019 prices in the tanker sale and purchase market declined by 20-25 %, but between October and December 2019 prices for crude oil tankers rose significantly, having gained 20 % compared to the end of 2018. Following growth in 2017, bulker prices stagnated in 2018 and during 2019.
| Indicator | 2019 | 2018Clarksons Research Services data for 2018 as of 31 December 2019 were updated in comparison with similar data as of 31 December 2018. | Difference, % |
|---|---|---|---|
| Number of ships sold | 379 | 336 | 12.80 |
| Total deadweight of sold ships ('000 tonnes) | 34,127 | 32,015 | 6.60 |
| Total value of sales (USD million) | 5,952 | 4,995 | 19.16 |
During 2019, the bulk of the demand in the shipbuilding market was for LNG carriers. This was associated with the development of new large liquefied gas production projects and high freight rates (speculative demand). Besides, there was heightened demand for large-capacity container carriers and conventional tankers. The demand for bulkers stagnated. Overall, the total number of orders for new ships in 2019 decreased compared to 2018.
In 1H 2019, prices for newbuilds were rising at Korean yards, while shipbuilding contract prices in China and Japan were stable. The stagnation of prices in China since the beginning of 2019 was due to a reduction in government support for fleet renewal programmes of local shipowners. The price disparity between South Korean and Chinese yards increased by mid-year, and a sig-nificant number of customers for ships (excluding LNG carriers) gave preference to Chinese yards. The demand for services of Korean shipbuilders declined, causing a small price correction. The start of the merger between Korea’s Hyundai Heavy Industries and Daewoo Shipbuilding & Marine Engineering, as well as between China’s largest state-owned shipbuilding companies CSSC and CSIC, did not lead to an increase in shipbuilding contract prices as at the end of 2019.
| Type of vessel | 2019 | 2018Clarksons Research Services data for 2018 as of 31 December 2019 were updated in comparison with similar data as of 31 December 2018. | Difference, % |
|---|---|---|---|
| Crude oil and product tankers | 184 | 207 | -11.11 |
| Chemical tankers | 35 | 62 | -43.55 |
| LNG carriers | 57 | 49 | 16.33 |
| LNG carriers | 61 | 77 | -20.78 |
| Total | 337 | 395 | -14.68 |